source("lib/variable_utils.r")Fetch Analyses metadata for a Study
R
This is a static preview
You can run and edit these examples interactively on Galaxy

![]()
Fetch a Study using MGnifyR; download the metadata for all of its Analyses
The MGnify API returns data and relationships as JSON. MGnifyR is a package to help you read MGnify data into your R analyses.
This example shows you how fetch the Analyses for a Study into a Phyloseq object
You can find all of the other “API endpoints” using the Browsable API interface in your web browser.
This is an interactive code notebook (a Jupyter Notebook). To run this code, click into each cell and press the ▶ button in the top toolbar, or press shift+enter.
mgnify_study_accession <- get_variable_from_link_or_input('MGYS', 'Study Accession', 'MGYS00005116')

# You can also just directly set the accession variable in code, like this:
# mgnify_study_accession <- "MGYS00005292"
Using Study Accession = MGYS00005292 from the link you followed.
Using "MGYS00005292" as Study Accessionlibrary(vegan)
library(ggplot2)
library(phyloseq)
library(MGnifyR)
mg <- mgnify_client(usecache = T, cache_dir = '/home/jovyan/.mgnify_cache')Loading required package: permute
Loading required package: lattice
This is vegan 2.6-4
library(IRdisplay)
display_markdown(file = '../_resources/mgnifyr_help.md')
Help with MGnifyR
MGnifyR is an R package that provides a convenient way for R users to access data from the MGnify API.
Detailed help for each function is available in R using the standard ?function_name command (i.e. typing ?mgnify_query will bring up built-in help for the mgnify_query command).
A vignette is available containing a reasonably verbose overview of the main functionality. This can be read either within R with the vignette("MGnifyR") command, or in the development repository
MGnifyR Command cheat sheet
The following list of key functions should give a starting point for finding relevent documentation.
mgnify_client(): Create the client object required for all other functions.mgnify_query(): Search the whole MGnify database.mgnify_analyses_from_xxx(): Convert xxx accessions to analyses accessions. xxx is either samples or studies.mgnify_get_analyses_metadata(): Retrieve all study, sample and analysis metadata for given analyses.mgnify_get_analyses_phyloseq(): Convert abundance, taxonomic, and sample metadata into a single phyloseq object.mgnify_get_analyses_results(): Get functional annotation results for a set of analyses.mgnify_download(): Download raw results files from MGnify.mgnify_retrieve_json(): Low level API access helper function.
Fetch a list of the Analyses for the Study
analyses_accessions <- mgnify_analyses_from_studies(mg, mgnify_study_accession)
analyses_accessions
| | | 0% | |======================================================================| 100%- 'MGYA00448077'
- 'MGYA00448078'
- 'MGYA00448079'
- 'MGYA00448080'
- 'MGYA00448081'
- 'MGYA00448082'
- 'MGYA00448083'
- 'MGYA00448084'
- 'MGYA00448085'
- 'MGYA00448086'
- 'MGYA00448087'
- 'MGYA00448088'
- 'MGYA00448089'
- 'MGYA00448090'
- 'MGYA00448091'
- 'MGYA00448092'
- 'MGYA00448093'
- 'MGYA00448094'
- 'MGYA00448095'
- 'MGYA00448096'
- 'MGYA00448097'
- 'MGYA00448098'
- 'MGYA00448099'
- 'MGYA00448100'
- 'MGYA00448101'
- 'MGYA00448102'
- 'MGYA00448103'
- 'MGYA00448104'
- 'MGYA00448105'
- 'MGYA00448106'
- 'MGYA00448107'
- 'MGYA00448108'
- 'MGYA00448109'
- 'MGYA00448110'
- 'MGYA00448111'
- 'MGYA00448112'
- 'MGYA00448113'
- 'MGYA00448114'
- 'MGYA00448115'
- 'MGYA00448116'
- 'MGYA00448117'
- 'MGYA00448118'
- 'MGYA00448119'
- 'MGYA00448120'
- 'MGYA00448121'
- 'MGYA00448122'
- 'MGYA00448123'
- 'MGYA00448128'
- 'MGYA00448129'
- 'MGYA00448130'
- 'MGYA00448131'
- 'MGYA00452518'
Download metadata for the first 10 Analyses
…and put it into a dataframe.
analyses_metadata_df <- mgnify_get_analyses_metadata(mg, head(analyses_accessions, 10)); | | | 0% | |======= | 10% | |============== | 20% | |===================== | 30% | |============================ | 40% | |=================================== | 50% | |========================================== | 60% | |================================================= | 70% | |======================================================== | 80% | |=============================================================== | 90% | |======================================================================| 100%Display metadata
The table could be big, so let’s look at a sample of it (head)
t(head(analyses_metadata_df))| MGYA00448077 | MGYA00448078 | MGYA00448079 | MGYA00448080 | MGYA00448081 | MGYA00448082 | |
|---|---|---|---|---|---|---|
| analysis_experiment-type | amplicon | amplicon | amplicon | amplicon | amplicon | amplicon |
| analysis_pipeline-version | 4.1 | 4.1 | 4.1 | 4.1 | 4.1 | 4.1 |
| analysis_accession | MGYA00448077 | MGYA00448078 | MGYA00448079 | MGYA00448080 | MGYA00448081 | MGYA00448082 |
| analysis_analysis-status | completed | completed | completed | completed | completed | completed |
| analysis_is-private | FALSE | FALSE | FALSE | FALSE | FALSE | FALSE |
| analysis_complete-time | 2020-01-31T08:26:49 | 2020-01-31T08:27:25 | 2020-01-31T08:28:04 | 2020-01-31T08:28:42 | 2020-01-31T08:29:18 | 2020-01-31T08:29:55 |
| analysis_instrument-platform | ILLUMINA | ILLUMINA | ILLUMINA | ILLUMINA | ILLUMINA | ILLUMINA |
| analysis_instrument-model | Illumina HiSeq 2500 | Illumina HiSeq 2500 | Illumina HiSeq 2500 | Illumina HiSeq 2500 | Illumina HiSeq 2500 | Illumina HiSeq 2500 |
| analysis_Submitted nucleotide sequences | 904340 | 358953 | 783008 | 1248244 | 756120 | 159581 |
| analysis_Nucleotide sequences after format-specific filtering | 904336 | 358952 | 783006 | 1248242 | 756118 | 159581 |
| analysis_Nucleotide sequences after length filtering | 893818 | 355241 | 773032 | 1234032 | 744796 | 157928 |
| analysis_Nucleotide sequences after undetermined bases filtering | 893818 | 355241 | 773032 | 1234032 | 744796 | 157928 |
| analysis_Reads with predicted CDS | 4512 | 18366 | 3630 | 5024 | 5134 | 2025 |
| analysis_Reads with predicted RNA | 888109 | 326189 | 757435 | 1227283 | 739097 | 147150 |
| analysis_Reads with InterProScan match | 2513 | 1157 | 2257 | 2754 | 3148 | 272 |
| analysis_Predicted CDS | 4515 | 18369 | 3633 | 5026 | 5137 | 2029 |
| analysis_Predicted CDS with InterProScan match | 2513 | 1157 | 2258 | 2754 | 3148 | 272 |
| analysis_Total InterProScan matches | 3907 | 1794 | 3507 | 4284 | 4884 | 428 |
| analysis_acc_type | analysis-jobs | analysis-jobs | analysis-jobs | analysis-jobs | analysis-jobs | analysis-jobs |
| study_attributes.accession | MGYS00005292 | MGYS00005292 | MGYS00005292 | MGYS00005292 | MGYS00005292 | MGYS00005292 |
| study_attributes.samples-count | 27 | 27 | 27 | 27 | 27 | 27 |
| study_attributes.bioproject | PRJNA319355 | PRJNA319355 | PRJNA319355 | PRJNA319355 | PRJNA319355 | PRJNA319355 |
| study_attributes.is-private | FALSE | FALSE | FALSE | FALSE | FALSE | FALSE |
| study_attributes.secondary-accession | SRP091672 | SRP091672 | SRP091672 | SRP091672 | SRP091672 | SRP091672 |
| study_attributes.centre-name | Jet Propulsion Laboratory, California Institute of Technology | Jet Propulsion Laboratory, California Institute of Technology | Jet Propulsion Laboratory, California Institute of Technology | Jet Propulsion Laboratory, California Institute of Technology | Jet Propulsion Laboratory, California Institute of Technology | Jet Propulsion Laboratory, California Institute of Technology |
| study_attributes.study-abstract | The environmental microbiome study was designed to decipher microbial diversity of the International Space Station surfaces in terms of spatial and temporal distributions by the next-generation sequencing of 16S rRNA and ITS. | The environmental microbiome study was designed to decipher microbial diversity of the International Space Station surfaces in terms of spatial and temporal distributions by the next-generation sequencing of 16S rRNA and ITS. | The environmental microbiome study was designed to decipher microbial diversity of the International Space Station surfaces in terms of spatial and temporal distributions by the next-generation sequencing of 16S rRNA and ITS. | The environmental microbiome study was designed to decipher microbial diversity of the International Space Station surfaces in terms of spatial and temporal distributions by the next-generation sequencing of 16S rRNA and ITS. | The environmental microbiome study was designed to decipher microbial diversity of the International Space Station surfaces in terms of spatial and temporal distributions by the next-generation sequencing of 16S rRNA and ITS. | The environmental microbiome study was designed to decipher microbial diversity of the International Space Station surfaces in terms of spatial and temporal distributions by the next-generation sequencing of 16S rRNA and ITS. |
| study_attributes.study-name | International Space Station Microbial Observatory - Microbial Diversity | International Space Station Microbial Observatory - Microbial Diversity | International Space Station Microbial Observatory - Microbial Diversity | International Space Station Microbial Observatory - Microbial Diversity | International Space Station Microbial Observatory - Microbial Diversity | International Space Station Microbial Observatory - Microbial Diversity |
| study_attributes.data-origination | HARVESTED | HARVESTED | HARVESTED | HARVESTED | HARVESTED | HARVESTED |
| study_attributes.last-update | 2020-02-03T17:20:50 | 2020-02-03T17:20:50 | 2020-02-03T17:20:50 | 2020-02-03T17:20:50 | 2020-02-03T17:20:50 | 2020-02-03T17:20:50 |
| study_accession | MGYS00005292 | MGYS00005292 | MGYS00005292 | MGYS00005292 | MGYS00005292 | MGYS00005292 |
| study_acc_type | studies | studies | studies | studies | studies | studies |
| sample_biosample | SAMN05581714 | SAMN05581715 | SAMN05581716 | SAMN05581717 | SAMN05581718 | SAMN05581719 |
| sample_accession | SRS2065862 | SRS2065861 | SRS2065860 | SRS2065859 | SRS2065858 | SRS2065857 |
| sample_analysis-completed | 2019-06-10 | 2019-06-10 | 2019-06-10 | 2019-06-10 | 2019-06-10 | NA |
| sample_collection-date | 2016-05-05 | 2016-05-06 | 2016-05-06 | 2016-05-06 | 2016-05-06 | 2016-05-06 |
| sample_sample-desc | Flight 3, location 1 | Flight 3, location 2 | Flight 3, location 3 | Flight 3, location 4 | Flight 3, location 5 | Flight 3, location 6 |
| sample_sample-name | IIIF1SW | IIIF2SW | IIIF3SW | IIIF4SW | IIIF5SW | IIIF6SW |
| sample_sample-alias | IIIF1SW | IIIF2SW | IIIF3SW | IIIF4SW | IIIF5SW | IIIF6SW |
| sample_last-update | 2020-05-22T00:38:53 | 2020-05-22T00:31:53 | 2020-05-22T00:27:01 | 2020-05-22T00:40:40 | 2020-01-31T08:33:44 | 2020-01-31T08:36:33 |
| sample_collection date | 2016-05-05 | 2016-05-06 | 2016-05-06 | 2016-05-06 | 2016-05-06 | 2016-05-06 |
| sample_instrument model | Illumina HiSeq 4000 | Illumina HiSeq 4000 | Illumina HiSeq 4000 | Illumina HiSeq 4000 | Illumina HiSeq 4000 | NA |
| sample_last update date | 2017-11-08 | 2017-11-08 | 2017-11-08 | 2017-11-08 | 2017-11-08 | NA |
| sample_acc_type | samples | samples | samples | samples | samples | samples |
| run_accession | SRR6132556 | SRR6132555 | SRR6132554 | SRR6132553 | SRR6132552 | SRR6132551 |
| biome_string | root:Engineered:Built environment | root:Engineered:Built environment | root:Engineered:Built environment | root:Engineered:Built environment | root:Engineered:Built environment | root:Engineered:Built environment |
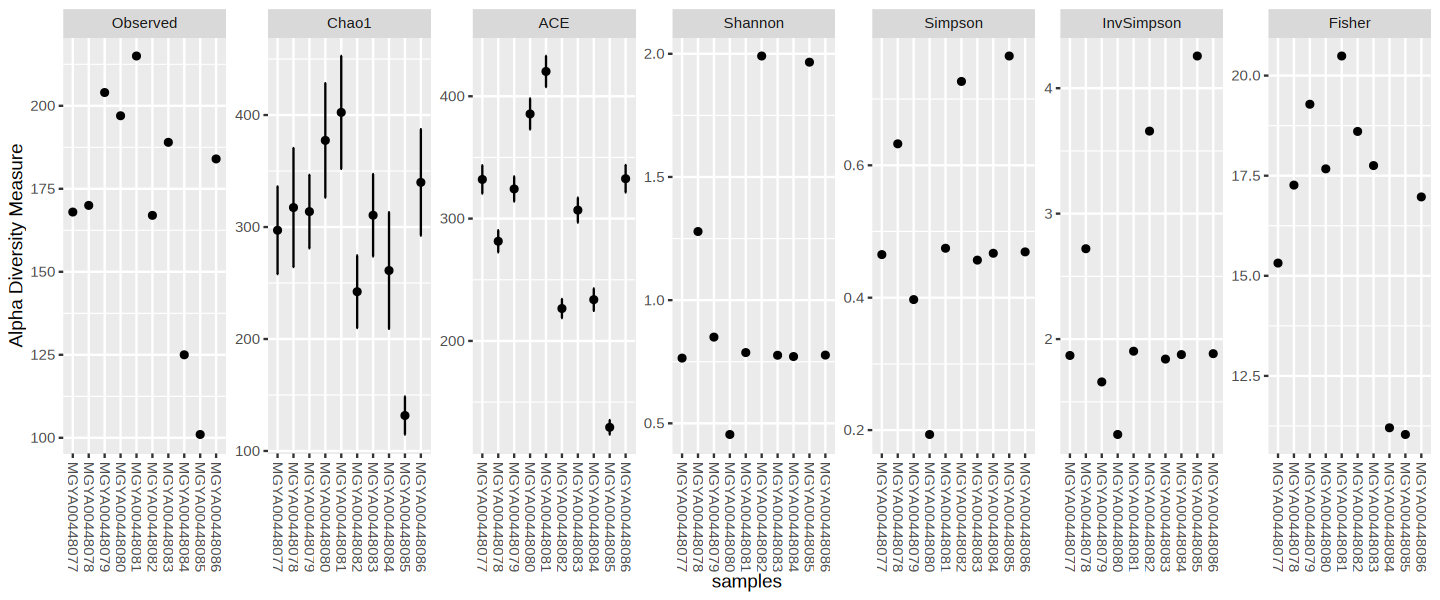
Convert to phyloseq
The phyloseq package is a tool to import, store, analyze, and graphically display complex phylogenetic sequencing data that has already been clustered into Operational Taxonomic Units (OTUs), especially when there is associated sample data, phylogenetic tree, and/or taxonomic assignment of the OTUs.
analyses_ps <- mgnify_get_analyses_phyloseq(mg, analyses_metadata_df$analysis_accession, tax_SU = "SSU") | | | 0% | |======= | 10% | |============== | 20% | |===================== | 30% | |============================ | 40% | |=================================== | 50% | |========================================== | 60% | |================================================= | 70% | |======================================================== | 80% | |=============================================================== | 90% | |======================================================================| 100%You can now use any of the phyloseq methods to explore this Study’s Analyses (run ?phyloseq in a code cell to learn more).
You could also use further MGnifyR features, e.g. to download data. Check the Cheat Sheet at the top for more.
Example of Phyloseq usage:
options(repr.plot.width=12, repr.plot.height=5)
plot_phyloseq(analyses_ps, )